Monday, October 30, 2023

… Low-Approval Numbers for Biden


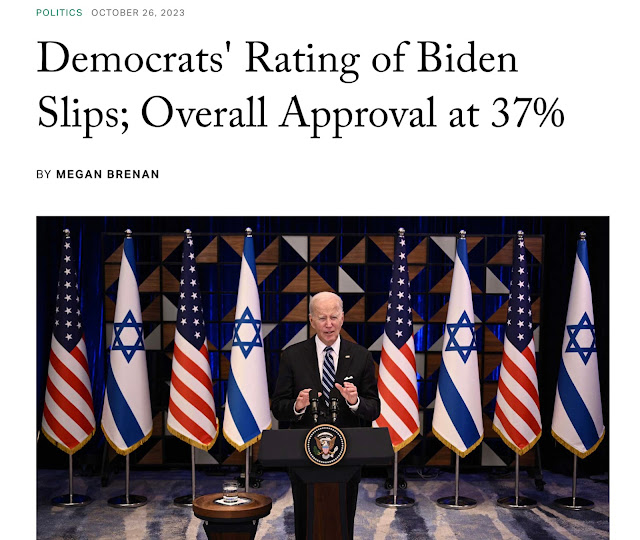
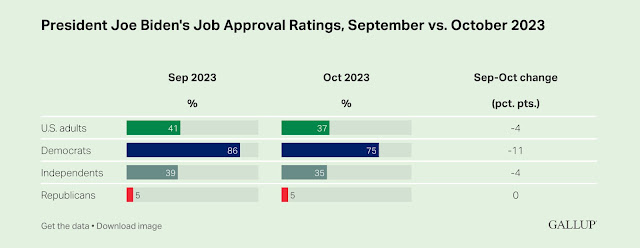
Last week, Gallup reported U.S. president Joe Biden has a job-approval—latest numbers—of 37 percent.

This is, of course, nationwide.

His job-approval percentage with self-identified Democrats is at 75.

His job-approval percentage with self-identified Independents—which is really a category for all who are outside the two major U.S. political parties (but without citing a specific third party)—is at 39.


Given the date of this blog topic, the good news for President Biden is that we are not yet heading into November of 2024. We are still in 2023. But, certainly from the position of Biden and his administration as well as the Democratic Party, this is a problem.

His job approval with his party should be at least 90 percent.

His job approval with Independents should be, at a minimum, in the upper-40s percentile range.

My feeling is this: If Election 2024 ends up a Democratic hold for U.S. President—specifically with Joe Biden or anyone who would replace him—the U.S. Popular Vote would be a minimum 5-point margin (up from +4.45 from 2020)—and for reasons I will explain in next week’s blog topic.

I think, with 53 weeks from Election Day, this is considerably important. It does not mean Biden’s approval will not increase. (You can see from the following chart the status of post-World War II U.S. presidents on the same timeline. I consider 2011 Barack Obama. I also consider 2019 Donald Trump.) But, it can also mean that, come October 2024, the approval on Biden would also suggest, as it does now, he would not win re-election…and that the White House incumbent Democratic Party—no matter their general-election nominee—would not be able to hold the presidency.


In the meantime, I will leave a link to this Gallup report.

Democrats' Rating of Biden Slips; Overall Approval at 37%

Monday, October 23, 2023

… Not Enough Difference

The recent Israel–Hamas conflict, and that there has been numerous factions in the U.S. claiming innocence on behalf Israel, serves as a reminder—given next year’s presidential election—there is Not Enough Difference between the two major United States political parties. 

This can be difficult for some. People who self-identify with one of the two major U.S. political parties do so with confidence. And it is painful to face the music.

The following video shows some examples—particular individuals and sources—which illuminates this point.


Monday, October 16, 2023

… Third Parties, Part II


This is the second and last of a two-part focus on Third Parties.

The Elections [Structure]

In the October 2, 2023 Progressives Chat, the topic was on Polls. Well, some of these polls do not have a hypothetical two-party matchup for Election 2024 in which the duo add up to the historic average (which I will address). Typically they do not reach that level because, in part, there are plenty of people who will answer such polls with not being willing to vote for either the Republican or the Democrat in that hypothetical matchup. However, in general elections, no matter the two-party matchup…they do.

The first United States presidential election was in 1789. The second was in 1792. From that point forward, U.S. presidential elections have been scheduled in leap years. Since 1824, the U.S. Popular Vote has been recorded.

In the 50 U.S. presidential elections of 1824 to 2020, which have included the U.S. Popular Vote, the average combined percentage of the two-party matchup has been 93.89 percent.

This takes into account that, in Election 1912, Republican incumbent William Howard Taft was unseated so badly, by Democratic challenger Woodrow Wilson, that Taft actually finished in third place. The previous Republican-affiliated U.S. president Teddy Roosevelt, as the Progressive Party nominee, finished in second place. So, in this case, I counted the two top vote-getters to factor these numbers. 

(My source for these past U.S. presidential elections is Wikipedia. Some sources can vary reporting the last number or two following the decimal point of a whole number. But, I am OK with this source for this particular topic.)

It turns out, historically, the average percentage of the U.S. Popular Vote by third-party candidates has been 6.11 percent. Mind you…this isn’t just one third-party nominee, with each of the past 50 election cycles, but the combined percentage of all votes to all candidates outside the two major political parties (or two top vote-getters).

Since my birth year 1971, and with Election 1972 the first in my life, there has been a period of 48 years and 13 election cycles. From this, the average percentage of the two-party vote has been 95.48 percent…with 4.52 percent combined for all candidates outside the two major parties.

When I look at information on percentage-points margins, like a poll report saying a candidate is leading by +5 percentage points nationwide, I tend to think of the general-election scenario as 51 to 46 percent or 52 to 47 percent in the U.S. Popular Vote. For good reasons.

Since Election 1972, 8 of the 13 cycles have seen the two-party matchup combine for 97 to 99 percent in the U.S. Popular Vote…leaving a small buffer of 1 to 3 percent combined for all candidates outside the two major political parties. 10 of the 13 cycles have seen the two-party matchup over that historic average of 93.89 percent in the U.S. Popular Vote. (Only in 1980, 1992, and 1996 was the two-party U.S. Popular Vote under that historic average of 93.89 percent. Just the latter two elections were under 90 percent.)

When reflecting even further, I looked at 20th-century U.S. presidential elections in which anything on the map was carried by third-party candidates. (1992 Independent Ross Perot received 18.91 percent in the U.S. Popular Vote and carried no states and electoral votes…and he finished second in Maine and Utah.) Turns out there were four such elections. They appear in the above image.

What tends to carry electorally for third-party candidates are states which are/were, in present time, aligned to the political party to which that third-party candidate is/was closer. 

Consider:

• In 1912, Progressive Party nominee and former Republican U.S. president Teddy Roosevelt (with 27.40 percent in the U.S. Popular Vote) carried: California, Michigan, Minnesota, Pennsylvania, South Dakota, and Washington. (This was in a period in which Republicans had alignment outside the South.)

• In 1924, Progressive Party nominee Robert La Follette Sr. (with 16.61 percent in the U.S. Popular Vote) carried the state he governed and in which he had been one of its U.S. senators (as he was affiliated with the Republican Party): Wisconsin.

• In 1948, States’ Rights nominee and Democratic Party member of the U.S. Senate Strom Thurmond (with 2.41 percent in the U.S. Popular Vote) carried: Alabama, Louisiana, Mississippi, and his home state South Carolina.

• In 1968, George Wallace (with 13.53 percent in the U.S. Popular Vote) was the American Independent nominee in spite of having affiliated with the Democratic Party. He carried states then-aligned to that party (when they had the more general alignment in the South): his home state Alabama, which he had governed, as well as Arkansas, Georgia, Louisiana, and Mississippi.

I sense that, if we are to get a coming U.S. presidential election cycle in which a third-party candidate could carry on the map, the outcome would be in a similar vein. For example: Had Election 2016 seen Libertarian Party nominee Gary Johnson carry a state, it would have been one aligned to the Republican Party. Likewise that year’s Green Party nominee, Jill Stein, who would have likely carried a state aligned to the Democratic Party.

This is a very structured system. Which may be a kind way of stating it. The conclusion I have reached is this: While it is good to be informed, for as much as one can ask of himself (with regard for this topic), it is still important to handle one’s voting however one will. If one chooses to vote outside the two major U.S. political parties…one may do so regardless of historic, electoral pattern.
Monday, October 9, 2023

… Third Parties, Part I


In this two-part blog topic on Third Parties, and with the second part next week, I will first address:


The Campaign

Last week, Cornel West announced he is switching from running in the 2024 United States presidential election as a Green Party candidate to that of an independent.

Not long ago, seemingly around a 90-day window, he was previously a candidate for The People’s Party.

Decisions like this do not sound decisive. They do not come across as focused. It strikes people as unserious.

I do not wish anything negative of Cornel West, or his campaign, but since this is a blog I know I can be direct with giving my two-cents.

This is a waste.

Given this topic is in October 2023…it would not surprise me, six months out, if Mr. West “suspends” his campaign by April 2024. 

After April 2024, and given his recent Jimmy Dore Show interview, Mr. West can turn around in time for the general-election season and endorse Joe Biden—or if anyone else becomes the 2024 Democratic Party’s nominee—for president of the United States. 

After all, as Mr. West has stated (numerous times): Donald Trump, who many are sensing will become re-nominated by the Republican Party for a third consecutive election cycle, is a “neofascist” and Joe Biden is only a “neoliberal.”

This is an important distinction by Mr. West. He is running outside the two major U.S. political parties. He is supposed to try to win as much of a coalition—perhaps even reach that dreamy 5 percent in the U.S. Popular Vote—which combines both factions of voters who are usually more leaning to the Republican Party and more leaning to the Democratic Party. And he lets us know there is a difference between the two major political parties.

Imagine people—citizens who will vote—processing that.

If you enter a presidential race…and you are outside the two major U.S. political parties…and you have the benefit of being a name…you do not run this campaign.

Monday, October 2, 2023

… Polls


A recent poll from ABC News/Washington Post reports former U.S. president Donald Trump (R–Florida) nationally leads current U.S. president Joe Biden (D–Delaware), in a hypothetical general-election matchup, by +9 percentage points. (It reads as: Trump 51% vs. Biden 42%.)

(Source: Trump edges out Biden 51-42 in head-to-head matchup: POLL.)

In 2020, Biden unseated Trump with a U.S. Popular Vote margin of +4.45 percentage points. (Outcome: Biden 51.26% vs. Trump 46.80%.)

The reaction, more than this poll, interests me.

People know that polls, a year or so in advance of a general election for a presidential election, is not necessarily what will play out. That it was a poll

Insiders know whether a given poll is believable given, in part, the sampling and the crosstabs.

Mainstream Democratic Party-friendly outlets freaked out and were whining about this poll. There was another poll, this past summer, with Trump nationally leading Biden by +6. That poll, too, caused a meltdown among the same faction.

People really taking to this most recent poll should keep in mind that many people are not tuned in. A lot of people do not want to address electoral politics until Election Time has arrived.

I estimate Election Time as a 60-day window. The general election will be Tuesday, November 5, 2024. So, perhaps September 5, 2024 can be considered the start of when people will be moving themselves to that point of decision.

(This is the first of a series of electoral-related topics which will run through November 6, 2023.)


UPDATE 10.02.2023 @ 07:30 P.M. ET: Revolutionary Blackout published to YouTube a video clip, from a previous livestream, with reaction. It is certainly related to this blog topic. 


Disqus for progressiveschat-blogspot-com