We are 18 months from the United States presidential election of 2020.
The scheduled date is Tuesday, November 3, 2020.
The last time a presidential election was held on November 3 was in 1992.
Since 1992, the average number of states carried between winning Republicans George W. Bush and Donald Trump and Democrats Bill Clinton and Barack Obama have been 29. The range has been between 26 (that was 2012 Obama) to 32 (that was 1992 Clinton) carried states.
The period of 1992 to 2016 numbered 24 years and 7 election cycles of presidential winners having carried between 52 and 64 percent of the nation’s states. You have to go back to the period of 1876 to 1900—that was Rutherford Hayes to the second term of William McKinley—for presidential winners who carried in the 50s and 60s percentile range of states.
This is historically under average. From 1789 George Washington to 2016 Donald Trump, the overall average has been 69.32 percent carriage of the nation’s states which, now that we have 50 states, averages 34.66 carried states. The United States presidential elections of 1992 to 2016 averaged 59.42 percent carriage of the nation’s states and 29.71 carried states.
This nation has not had a landslide presidential election—meaning, to the tune of 40 states (which is carried of four of every five states; 80 percent or above of the nation’s states—since the 1980s. Of the 25 presidential elections of the 20th century, 11 were such landslides. They occurred in the following years: 1912, 1928, 1932, 1936, 1952, 1956, 1964, 1972, 1980, 1984, and 1988.
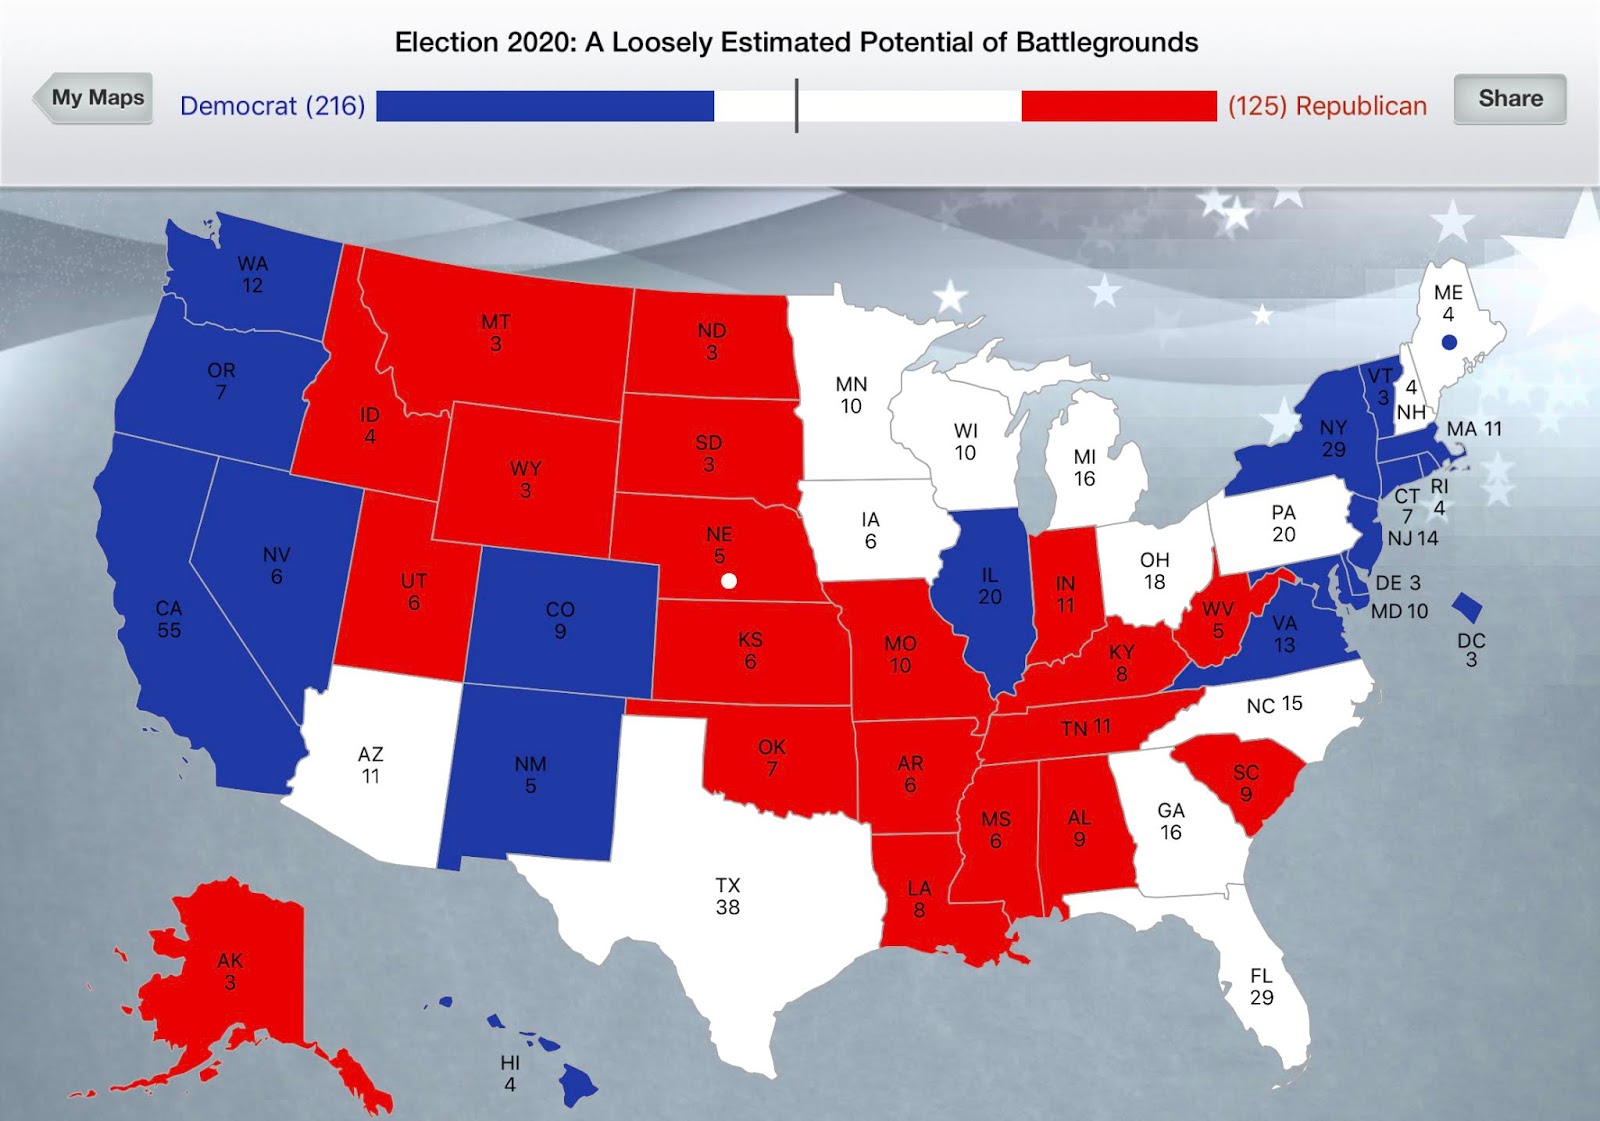
The above map is not necessarily my official estimate of what will be the battlegrounds for 2020. (I don’t know, for fact, what will play out in the 2020 Democratic presidential primaries.) They are to be kept in mind with the date of this blog topic. What appears in white, to indicate tossups, are best-case scenarios for both major political parties. Some, like Iowa and Ohio—which, effective with 2016, are estimated by many to have moved from bellwether states to Lean Republican states—are loosely presented in white just in case a 2020 Democratic candidate (specifically, if that nominee ends up an actual progressive specifically with Bernie Sanders or Tulsi Gabbard) unseats Republican incumbent U.S. president Donald Trump. (The white dot is Nebraska’s 2nd Congressional District. The blue dot is the likely Democratic hold of Maine’s 1st Congressional District. This has to do with particular settings from the 270 to Win I had app used from my iPad.) States that Trump did not flip and carry in 2016—specifically Maine (statewide), Minnesota, and New Hampshire—were carried by 2016’s losing Democratic nominee Hillary Clinton by margins of less than 3 percent points. (Re-elections for 1996 Bill Clinton and 2004 George W. Bush resulted in 3-point margin gains in the U.S. Popular Vote.) They are also in white just in case the 2020 Democrats nominate another hollow corporatist which results in re-election for Trump. (Side note: The Democrats’ and media’s latest push for Joe Biden has history against the 47th U.S. vice president. To date, there has been no former U.S. vice president who unseated an incumbent U.S. president.)
This is a harmless exercise. It is worthy trying to be as aware as much as he can ask of himself. (I wrote about a related topic in April 2018: Election 2020’s Key Bellwethers: The Rust Belt Trio Wisconsin, Pennsylvania, and Michigan.)
I have come across two members with published YouTube videos who engage in scenario electoral outcomes: YouTube — Let’s Talk Elections and YouTube — Political Forecast. Some of what gets said, in their analyses, does not jibe with reality. For example: The best bellwether state nowadays is Florida. Its unbroken streak of voting with presidential winners dates back to 1996. Since then, it has performed within five percentage points in its margins from the ones in the U.S. Popular Vote. (Ohio—with its unbroken streak of voting with presidential winners from 1964 to 2016—did this from 1964 to 2012.) In the midterm elections of 2018, Florida was the only state which matched and/or reflected the national party winners for majorities with the U.S. House (a Democratic pickup), U.S. Senate (Republican hold with a net gain of +2, including bellwether Florida), and U.S. Governors (Republican majority hold). (Pending the outcome of North Carolina #09, Florida gave the 2018 Democrats, who flipped the U.S. House with +40 seats, a net gain of +2. Florida was one of 21 involved states. So, it also reflected the national average.) Let’s Talk Elections, in particular, has numerous videos in which he appears to not recognize this, about Florida, and assumes—even if the 2020 Democratic nominee unseats Republican incumbent U.S. president Donald Trump—the state is Lean Republican. (This is due to the 2018 Democrats seeing Bill Nelson unseated by Rick Scott for U.S. Senate as well as Andrew Gillum failing to flip the governorship as it narrowly held GOP for Ron DeSantis.) Yet, Let’s Talk Elections cites Iowa (+9.41) which, in 2016, performed a good 8 points redder than Florida (+1.19) as the more flippable of the two for the 2020 Democrats. He has that wrong. Florida was less than a half-point redder than Wisconsin (+0.76), the tipping point state of Election 2016, and it will join that Rust Belt state—along with Pennsylvania (+0.72) and Michigan (+0.22)—with an approximately 95-percent likelihood of voting again with the winner in 2020.
No comments:
Post a Comment