
Political analyst Ronald Brownstein has a very interesting piece, published to The Atlantic’s website last Thursday [January 9, 2020], on potentially realigning electoral voting patterns.
Some of this won’t surprise. But, I do have a reaction that is this blog’s topic post.
Article link: Democrats’ Future Is Moving Beyond the Rust Belt.
Quote:
For Democrats, the Sun Belt imperative is growing more urgent. While most in the party are preoccupied with winning back the three Rust Belt states [Wisconsin, Pennsylvania, and Michigan] that tipped the 2016 election to Donald Trump, both people and political power are continuing to migrate inexorably from that region to the younger and more diverse states in the Southeast and Southwest.
This sustained population shift reinforces the consequences of Trump’s political repositioning of the Republican Party. Trump has targeted his polarizing message and agenda heavily toward the priorities of the older and non-college-educated white voters who still dominate most of the Rust Belt. That will make it tough for Democrats to rely on those states, particularly in presidential races, as much as they did during the 1990s and earlier this century.
In the near future, then, Democrats will likely need to offset any Republican gains in the Rust Belt by winning more elections in Sun Belt states, which are adding more of the diverse, white-collar, and urbanized voters at the core of the modern Democratic coalition. Through the coming decade and beyond, the crucial variable that could tilt the national balance of power between the parties may be whether Democrats can leverage those demographic advantages in the Sun Belt to break the hold Republicans have enjoyed on most of the region since at least the 1970s.
This analysis, by the excellent Ronald Brownstein, is anticipation of a possible and gradual realignment of some voting patterns involving particular states.
A clear way to understand this is to first look at where states came in for both Donald Trump (the Republican presidential pickup winner) and Hillary Clinton (who did not hold the presidency in the Democratic column after two terms won in 2008 and 2012 by Barack Obama) in Election 2016. I will not list all but will focus on those which ranked for each party between Nos. 18 to 32 (meaning, the fewest and most carried number of states by either party since 1992). I will list them in descending order by their margins with tracking their cumulative electoral votes. (In 2016, there were faithless electors for both Trump and Hillary. But, I will set those aside.)
Starting with:
Donald Trump (R)—Pickup Winner
✫✫✫ 45.93%; with 30 states, plus Maine’s 2nd Congressional District, and 306 original electoral votes] ✫✫✫
18. Mississippi +17.80 (cumulative 113 electoral votes)
19. Alaska +14.73 (cum. 116)
20. South Carolina +14.27 (cum. 125)
— Maine’s 2nd Congressional District [pickup] +10.28 (cum. 126)
21. Iowa [pickup] +9.41 (cum. 132)
22. Texas +8.98 (cum. 170)
23. Ohio [pickup] +8.07 (cum. 188)
24. Georgia +5.10 (cum. 204)
25. North Carolina +3.66 (cum. 219)
26. Arizona +3.50 (cum. 230)
— Nebraska’s 2nd Congressional District +2.23 (cum. 231)
27. Florida [pickup] +1.19 (cum. 260)
28. Wisconsin [pickup] +0.76 (cum. 270—Tipping-point state)
29. Pennsylvania [pickup] +0.72 (cum. 290)
30. Michigan [pickup] +0.22 (cumulative 306 original electoral votes)
Not carried:
31. New Hampshire –0.37 (cum. 310)
32. Minnesota –1.51 (cum. 320)
Hillary Clinton (D)
✫✫✫ 48.02%; with 20 states, plus District of Columbia, and 232 original electoral votes] ✫✫✫
18. Nevada +2.42 (cumulative 218 electoral votes)
19. Minnesota +1.51 (cum. 228)
20. New Hampshire +0.37 (cumulative 232 original electoral votes)
Not carried:
21. Michigan –0.22 (cum. 248)
22. Pennsylvania –0.72 (cum. 268)
23. Wisconsin –0.76 (cum. 278—Tipping-point state)
24. Florida –1.19 (cum. 307)
— Nebraska’s 2nd Congressional District –2.23 (cum. 308)
25. Arizona –3.50 (cum. 319)
26. North Carolina –3.66 (cum. 334)
27. Georgia –5.10 (cum. 350)
28. Ohio –8.07 (cum. 368)
29. Texas –8.98 (cum. 406)
30. Iowa –9.41 (cum. 412)
— Maine’s 2nd Congressional District –10.28 (cum. 413)
31. South Carolina –14.27 (cum. 422)
32. Alaska –14.73 (cum. 425)
Going by Ronald Brownstein’s piece, he perceives the Democrats’ future in the Sun Belt and not so much the Rust Belt. (He is not alone.)
I understand.
Since 1968, every time the White House switched parties, there was at least one pickup state which has since not flipped back to the party which lost it. This was the case with several states for: 1968 Republican pickup winner Richard Nixon (among them were North Dakota, South Dakota, statewide Nebraska, Kansas, as well as Idaho, Oklahoma, Utah, and Wyoming); 1976 Democratic pickup winner Jimmy Carter (Minnesota); 1980 Republican pickup winner Ronald Reagan (Alabama, Mississippi, South Carolina, and Texas); 1992 Democratic pickup winner Bill Clinton (California, Connecticut, Delaware, Illinois, statewide Maine, Maryland, New Jersey, and Vermont); 2000 Republican pickup winner George W. Bush (among them were Arkansas, Kentucky, Louisiana, Missouri, Tennessee, and West Virginia); and 2008 Democratic pickup winner Barack Obama (Colorado, Nevada, New Mexico, and Virginia).
Since 1992, presidential winners have carried between 26 (a 2012 re-elected Barack Obama) and 32 (a 1992 first-term-elected Bill Clinton) states. The Republican winners have averaged 9 (a 2000 and 2004 George W. Bush) and 10 (a 2016 Donald Trump) electoral votes per carried state. The Democratic winners have averaged 11 and 12 (a 1992 and 1996 Clinton) and 13 and 12 (a 2008 and 2012 Obama) electoral votes per carried state. So, structurally, Republicans need to carry at least 28 while Democrats need to carry at least 22 states to win. It may explain a formula for guessing how many states a prevailing Republican or Democrat carries. Add +28 for the Republican or +22 for the Democrat to what that winner’s U.S. Popular Vote margin would be. Winning by +4 means a Republican carries 32 and a Democrat carries 26 states. But, based on this post-1980s period electorally, the winning Republicans are more likely to carry at least 30 while winning Democrats carry at least 26 states.
For the 2020 Democrats: If their general-election nominee unseats Republican incumbent Donald Trump, he/she would start by flipping no less than the following states listed between Nos. 21 to 23 (because of their reach); but, come to think, he/she would need to win the U.S. Popular Vote by at least +8 percentage points to win back everything that flipped in 2016 for Trump. (Just three U.S. presidential elections—1824, 1960, and 1976—saw the winner carry less than half the nation’s states.) My estimate for their likely order:
21. Michigan (cum. 248)
22. Pennsylvania (cum. 268)
23. Wisconsin (cum. 278—Tipping-point state)
24. Florida (cum. 307)
— Nebraska’s 2nd Congressional District –2.23 (cum. 308)
25. Arizona (cum. 319)
26. North Carolina (cum. 334)
27. Georgia (cum. 350) | Target U.S. Popular Vote Margin: +5 (also the tipping-point state for 2020 Democrats in order to flip the U.S. Senate)
28. Iowa (cum. 356) | Target U.S. Popular Vote Margin: +6
— Maine’s 2nd Congressional District (cum. 357) | Target U.S. Popular Vote Margin: +6.50
29. Texas (cum. 395) | Target U.S. Popular Vote Margin: +7
30. Ohio (cum. 413) | Target U.S. Popular Vote Margin: +8
If 2020 ends up a Republican hold, with re-election for Donald Trump, the Democrats would much more likely get their presidential pickup in 2024. (Since the 1950s, only once has a political party won three consecutive election cycles—the Republicans of the 1980s.) With the potential of some states realigning, as has been suggested in this piece by Ronald Brownstein, here is an estimated, scenario order with use of the same selection of states for where they could get reshuffled in 2024. Instead of the 2016 (and, as estimated, 2020) tipping-point state being Wisconsin—closely followed by Pennsylvania and Michigan—one could be looking toward Arizona or Georgia as the tipping-point state. (I lean a little toward the Peach State.) A Democratic pickup of the presidency in 2024 could play out as follows (with use of the 2010s allocation of electoral votes):
— Nebraska’s 2nd Congressional District [pickup] (cumulative 233 electoral votes)—Realigned to the Democrats
21. North Carolina (cum. 248)—Realigned to the Democrats
22. Arizona (cum. 259)—Realigned to the Democrats
23. Georgia (cum. 275—Tipping-point state)—Realigned to the Democrats (with future Republicans needing to counter-flip some “Tint Lights” or “Solids”)
24. Florida (cum. 304)—Bellwether, minus two elections (1960 and 1992), since 1928
25. Texas (cum. 342)—Bellwether; it was a previous bellwether, minus 1968, from 1928 to 1988
26. Michigan (cum. 358)—Bellwether; voted the same as Pennsylvania, except in three elections (1932, 1940, and 1976), since 1860
27. Pennsylvania (cum. 378)—Bellwether; voted the same as Michigan, except in three elections (1932, 1940, and 1976), since 1860
— Maine’s 2nd Congressional District (cum. 379)—Realigned to the Republicans
28. Wisconsin (cum. 389)—Realigned to the Republicans; voted the same as Iowa, except in two elections (1976 and 2004), since 1944
29. Iowa (cum. 395)—Realigned to the Republicans; voted the same as Wisconsin, except in two elections (1976 and 2004), since 1944
30. Ohio (cum. 413)—Realigned to the Republicans
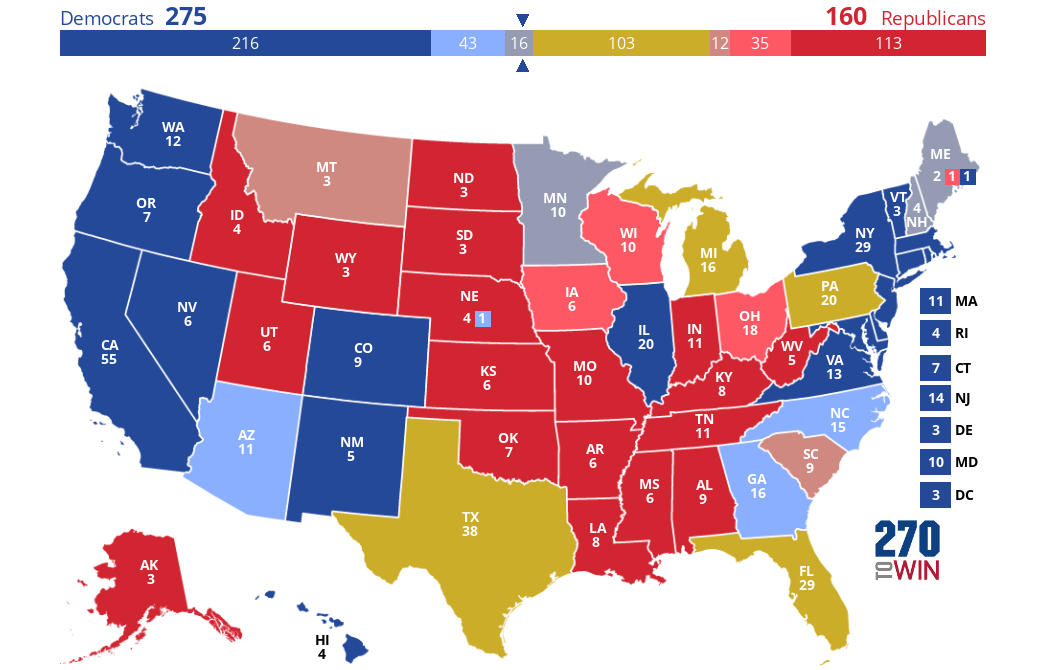
 Click the map to create your own at
 Color Code:
· Solids: States and districts appearing to be firewalls for respective political party; some unanticipated changes are possible, with however many emerging states, in the future· Medium Red: Potentially realigned to respective party, effective 2016
· Medium Light Blue: Anticipation of potential realignment to respective party, effective 2024
· Tint Lights: States which could become vulnerable to respective party to which they are currently aligned (or lean)
· Yellow: Possible bellwethers for an unbroken string of consecutive election cycles (Florida, since 1996; Michigan and Pennsylvania, since 2008; Texas, since 2016)
No comments:
Post a Comment